SOUTH AMERICA – BLACK IN THE WORLD
People of African descent form a significant percentage of the population in a number of South American nations. Because of widespread lack of agreement across South America about who is Black and because of confusion in enumeration, there are no reliable population figures, and many estimates and counts vary widely from each other. Nonetheless, it is clear that the countries with the largest Black populations as a percentage of national population are French Guiana (42.4 to66percent), Guyana (29.4 to 42.6 percent),Suriname (39.8 to 41 percent), Brazil (5.9 to 33 percent), Colombia (14 to 21 percent), Venezuela (9 to 10 percent), Ecuador (5 to 10 percent), and Peru (6 to 9.7 percent). Estimates of Bolivia’s Black population range as high as 2 percent. The total Black population of South America ranges somewhere between 19 and 67 million. The regions with the largest concentrations are northeastern Brazil; the interiors of Suriname, Guyana, and French Guiana; the Yungas of Bolivia; the northwest coast of Ecuador; the Pacific and Caribbean coasts and the Cauca Valley of Colombia; and the Llanos and the northern coast of Venezuela. Blacks in South America do not form a homogenous population; there are important differences based on skin color, extent of assimilation into White society, degree of allegiance to their African ancestry, and self-identification as the bearers of a distinct New World culture (as among Maroons in Suriname and French Guiana).
Source:http://www.everyculture.com/South-America/Afro-South-Americans.html#ixzz46VjOZn2M
Policy & Politics

Policy & Politics in South America
There were several migration waves and relocations which took place and affected people of African descent. Their place in society and opportunities of advancement remains challenged to various degrees in different parts of the world. In our Monthly Highlights section we feature individuals who have overcome, and who are testament of the redeeming power of determination and talent. Below are the accomplished individuals in Policy & Politics in South America.
Business & Education

Art & Culture

Art & Culture in South America
There were several migration waves and relocations which took place and affected people of African descent. Their place in society and opportunities of advancement remains challenged to various degrees in different parts of the world. In our Monthly Highlights section we feature individuals who have overcome, and who are testament of the redeeming power of determination and talent. Below are the accomplished individuals in Art & Culture in South America.
Almost all Blacks in South America are the descendants of Africans imported to the New World between 1518 and 1873. Altogether, about 10 million slaves were brought to the New World. About 3.5 million were brought by the Portuguese to Brazil to work on sugar and coffee plantations and in mines. Another 200,000 were imported to Colombia and used on sugar plantations and in gold mining. About 100,000 each were settled in Peru, Venezuela, and Argentina-Uruguay-Paraguay, where they mainly worked on sugar plantations but also as dock hands, miners, domestics, and as field hands in various agricultural ventures. Across South America, slavery ended between 1830 and 1888; Brazil was the last nation in the New World to outlaw the institution. Among factors associated with the demise of slavery were a marked decrease of the price of sugar on the world market, the development of more efficient agricultural technologies, the abolition movement in Europe and North America, and the cost to plantation owners of frequent slave rebellions.
Nonetheless, it is clear that the countries with the largest Black populations as a percentage of national population areFrench Guiana(42.4 to66percent),Guyana(29.4 to 42.6 percent),Suriname(39.8 to 41 percent), Brazil (5.9 to 33 percent), Colombia (14 to 21 percent),Venezuela(9 to 10 percent),Ecuador(5 to 10 percent), and Peru (6 to 9.7 percent). Estimates of Bolivia’s Black population range as high as 2 percent. The total Black poulation of South America ranges somewhere between 19 and 67 million. The regions with the largest concentrations are northeastern Brazil; the interiors of Suriname, Guyana, and French Guiana; theYungasof Bolivia; the northwest coast of Ecuador; the Pacific andCaribbeancoasts and the Cauca Valley of Colombia; and the Llanos and the northern coast of Venezuela. Blacks in South America do not form a homogenous population; there are important differences based on skin color, extent of assimilation into White society, degree of allegiance to their African ancestry, and self-identification as the bearers of a distinct New World culture (as among Maroons in Suriname and French Guiana).
Source: https://en.wikipedia.org/wiki/Afro-Latin_Americans
Argentina
Main article: Afro-Argentine
According to the Argentina national census of the year 2010, the total Argentine population amount is 40,117,096,[43] from which 149,493[44][45] are from African ancestry. Traditionally it has been argued that the black population in Argentina declined since the early 19th century to insignificance. However, the pilot census conducted in two neighborhoods of Argentina in 2006 on knowledge of ancestors from Subsaharan Africa verified that 5% of the population knew of Black African ancestry, and another 20% thought that was possible but not sure. Given that European immigration accounted for more than half the growth of the Argentine population in 1960, some researchers argue that rather than decrease what they had was a process of “invisibility” of the population Afro Argentine and their cultural roots.
Bolivia
Main article: Afro-Bolivian
Black African descendants in Bolivia account for about 2% of the population.[citation needed] They were brought in during the Spanish colonial times and the majority live in the Yungas. There are about 500,000 people of Black African ancestry living in Bolivia.
Brazil
Main articles: Afro-Brazilian, Pardo Brazilian and Mixed-race Brazilian
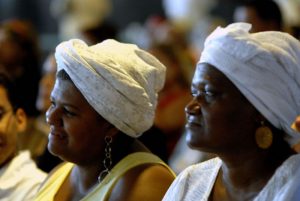
Image above shows Brazilian Quilombolas during a meeting in the capital of Brazil, Brasilia.
Around 7% of Brazil’s 190 million people reported to the census as Black, and many more Brazilians have some degree of African descent.[46]
Brazil experienced a long internal struggle over abolition of slavery and was the last Latin American country to adopt it. In 1850 it finally banned the importation of new slaves from overseas, after two decades since the first official attempts to outlaw the human traffic (in spite of illegal parties of Black African slaves that kept arriving till 1855). In 1864 Brazil emancipated the slaves, and on 28 September 1871, the Brazilian Congress approved the Rio Branco Law of Free Birth, which conditionally freed the children of slaves born from that day on. In 1887 army officers refused to order their troops to hunt runaway slaves, and in 1888 the Senate passed a law establishing immediate, unqualified emancipation. This law, known as Lei Áurea (Golden Law) was sanctioned by the regent Isabel, Princess Imperial of Brazil, daughter of the emperor Pedro II on 13 May 1888.
Genetic composition of Brazil, African contribution.
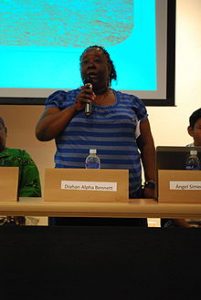
Image above shows Diahan Alpha Bennett representing English Creole speakers in Honduras at a conference at the Universidad Nacional Autónoma de Honduras.
uropean ancestry has primarily contributed to the formation of Brazil, along with African and Native American ancestries.
An autosomal study from 2013, with nearly 1300 samples from all of the Brazilian regions, found a predominant degree of European ancestry combined with African and Native American contributions, in varying degrees: “Following an increasing North to South gradient, European ancestry was the most prevalent in all urban populations (with values up to 74%). The populations in the North consisted of a significant proportion of Native American ancestry that was about two times higher than the African contribution. Conversely, in the Northeast, Center-West and Southeast, African ancestry was the second most prevalent. At an intrapopulation level, all urban populations were highly admixed, and most of the variation in ancestry proportions was observed between individuals within each population rather than among population”.
|
Region |
European |
African |
Native American |
| North Region | 51% | 17% | 32% |
| Northeast Region | 56% | 28% | 16% |
| Central-West Region | 58% | 26% | 16% |
| Southeast Region | 61% | 27% | 12% |
| South Region | 74% | 15% | 11% |
A recent autosomal DNA study (2011), with nearly 1000 samples from all over the country (“whites”, “pardos” and “blacks”) found a major European contribution, followed by a high African contribution and an important Native American component.[48] “In all regions studied, the European ancestry was predominant, with proportions ranging from 60.6% in the Northeast to 77.7% in the South”.[49] The 2011 autosomal study samples came from blood donors (the lowest classes constitute the great majority of blood donors in Brazil[50]), and also public health institutions personnel and health students. The study showed that Brazilians from different regions are more homogenous than previously thought by some based on the census alone. “Brazilian homogeneity is, therefore, a lot greater between Brazilian regions than within Brazilian regions”.[51]
|
Region[48] |
European |
African |
Native American |
| Northern Brazil | 68.80% | 10.50% | 18.50% |
| Northeast of Brazil | 60.10% | 29.30% | 8.90% |
| Southeast Brazil | 74.20% | 17.30% | 7.30% |
| Southern Brazil | 79.50% | 10.30% | 9.40% |
According to a DNA study from 2010, which used samples from the five regions of the country “on average, European ancestors are responsible for nearly 80% of the genetic heritage of the population. The variation between the regions is small, with the possible exception of the South, where the European contribution reaches nearly 90%.” The study by a team of the Catholic University of Brasília and published by the scientific magazine American Journal of Human Biology, show that “in Brazil, physical indicators such as skin colour, colour of the eyes and colour of the hair have little to do with the genetic ancestry of each person, which has been shown in previous studies (regardless of census classification).”[52] The study used ancestry informative SNPs to estimate individual and population biogeographical ancestry. It found the “Brazilian population is characterized by a genetic background of three parental populations (European, African, and Brazilian Native Amerindians) with a wide degree and diverse patterns of admixture” and estimated the major contribution being European ancestry (77.1%) followed by African (14.3%) and Amerindian contributions (8.5%).[53] It is important to note that “the samples came from free of charge paternity test takers, thus as the researchers made it explicit: “the paternity tests were free of charge, the population samples involved people of variable socioeconomic strata, although likely to be leaning slightly towards the ‘‘pardo’’ group“.[54]
|
Region[54] |
European |
African |
Native American |
| North Region | 71.10% | 18.20% | 10.70% |
| Northeast Region | 77.40% | 13.60% | 8.90% |
| Central-West Region | 65.90% | 18.70% | 11.80% |
| Southeast Region | 79.90% | 14.10% | 6.10% |
| South Region | 87.70% | 7.70% | 5.20% |
An autosomal DNA study from 2009 similarly found that “all the Brazilian samples (regions) lie more closely to the European group than to the African populations or to the Mestizos from Mexico”.[55]
|
Region[56] |
European |
African |
Native American |
| North Region | 60.6% | 21.3% | 18.1% |
| Northeast Region | 66.7% | 23.3% | 10.0% |
| Central-West Region | 66.3% | 21.7% | 12.0% |
| Southeast Region | 79.1% | 14.9% | 7.0% |
| South Region | 81.5% | 9.3% | 9.2% |
A 2015 autosomal genetic study, which also analysed data of 25 studies of 38 different Brazilian populations concluded that: European ancestry accounts for 62% of the heritage of the population, followed by the African (21%) and the Native American (17%). The European contribution is highest in Southern Brazil (77%), the African highest in Northeast Brazil (27%) and the Native American is the highest in Northern Brazil (32%).[57]
|
Region[57] |
European |
African |
Native American |
| North Region | 51% | 16% | 32% |
| Northeast Region | 58% | 27% | 15% |
| Central-West Region | 64% | 24% | 12% |
| Southeast Region | 67% | 23% | 10% |
| South Region | 77% | 12% | 11% |
According to another autosomal DNA study from 2008, by the University of Brasília (UnB), European ancestry dominates in the whole of Brazil (in all regions), accounting for 65.9% of heritage of the population, followed by the African contribution (24.8%) and the Native American (9.3%).[58]
São Paulo state, the most populous state in Brazil, with about 40 million people, showed the following composition, according to an autosomal study from 2006: European genes account for 79% of the heritage of the people of São Paulo, 14% are of African origin, and 7% Native American.[59] A more recent genetic study, from 2013, showed that people in São Paulo have 61.9% European, 25.5% African and 11.6% Amerindian ancestries, respectively.[60]
Chile
Main article: Afro-Chilean
Chile enslaved about 6,000 Africans, about one-third of whom arrived before 1615; most were utilized in agriculture around Santiago. Today there are very few Afro-Chileans, at the most, fewer than 0.001% can be estimated from the 2006 population.
An autosomal DNA study from 2014 found out Chile to be 44.34% (± 3.9%) Native American, 51.85% (± 5.44%) European and 3.81% (± 0.45%) african.[61][62]
A 2015 autosomal DNA study found out Chile to be 42.38% Native American, 55.16% European and 2.44% African (using LAMP-LD) and 43.22% Native American, 54.38% European and 2.40% African (using RFMix)[63]
Columbia
Main article: Afro-Colombian
Afro-Colombians make up 10.6% of the population, almost 4.9 million people, according to a projection of the National Administration Department of Statistics (DANE).[64] most of whom are concentrated on the northwest Caribbean coast and the Pacific coast in such departments as Chocó, although considerable numbers are also Cartagena, and Barranquilla.
Approximately 4.4 million Afro-Colombians actively recognize their own black ancestry as a result of inter-racial relations with white and indigenous Colombians. They have been historically absent from high level government positions.[citation needed] Many of their long-established settlements around the Pacific coast have remained underdeveloped. In Colombia’s ongoing internal conflict, Afro-Colombians are both victims of violence or displacement and members of armed factions, such as the FARC and the AUC. Afro-Colombians have played a role in contributing to the development of certain aspects of Colombian culture. For example, several of Colombia’s musical genres, such as Cumbia, have African origins or influences. Some Afro-Colombians have also been successful in sports such as Faustino Asprilla, Freddy Rincón or María Isabel Urrutia.
San Basilio de Palenque is a village in Colombia that is noted for maintaining many African traditions. It was declared a Masterpieces of the Oral and Intangible Heritage of Humanity by UNESCO in 2005.[65] The residents of palenque still speak Palenquero, a Spanish/African creole[66]
Equador
Main article: Afro-Ecuadorian
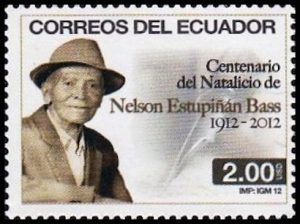
Image above shows Nelson Estupiñán Bass, afro-Ecuadorian poet in an Ecuadorian stamp.
In 2006, Ecuador had a population of 13,547,510. According to the latest data from CIA World Factbook, the makeup of the population is: “mestizo (mixed Amerindian and white) 65%, Amerindian 25%, Spanish and others 7%, African 3%“.[citation needed] The Afro-Ecuadorian culture is found in the northwest coastal region of Ecuador and make up the majority (70%) in the province of Esmeraldas and the Chota Valley in the Imbabura Province. They can be also found in Ecuador’s two largest cities, Quito and Guayaquil. The best known cultural influence known outside Ecuador is a distinctive kind ofmarimba music. From the Chota Valley there is Bomba (Ecuador) music which is very different from marimba from Esmeraldas.
Paraguay
Main article: Afro-Paraguayan
Black Paraguayans are descended from enslaved West African brought to Paraguay by the 16th century. They became a significant presence in the country, and made up 11% of the population in 1785. Most Afro-Paraguayans established communities in towns such as Areguá, Emboscada, andGuarambaré. Many achieved their freedom during the Spanish rule. In the capital Asunción, there is a community of 300 Afro-Paraguayan families in the Fernando de la Mora municipality.
Peru
Main article: Afro-Peruvian
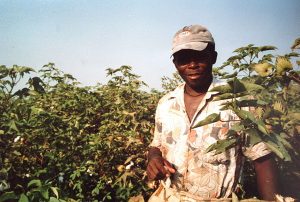
Image above shows Afro-Peruvian man in El Carmen near Chincha.
Afro-Peruvians make up about 3–4% of the population (close to two million).
Over the course of the slave trade, approximately 95,000 slaves were brought into Peru, with the last group arriving in 1850. Today, Afro-Peruvians reside mainly on the central and south coast. Afro-Peruvians can also be found in significant numbers on the northern coast. Recently, it has been verified that the community with the greatest concentration of Afro-Peruvians is Yapatera in Morropón (Piura), made up of around 7,000 farmers who are largely descended from African slaves of “malagasy” (Madagascar) origin. They are referred to as “malgaches” or “mangaches”.
Afro-Peruvian music and culture was popularized from the 1950s by the performer Nicomedes Santa Cruz.[67] Since 2006, his birthday, 4 June, has been celebrated in Peru as a Day of Afro-Peruvian Culture.[citation needed] Another key figure in the revival of Afro-Peruvian music is Susana Baca.
Afro-Peruvian music was actually well known in Peru since the 1600s but oppressed by the Peruvian elite, as was Andean religion and language. Afro-Peruvian culture has not only thrived but influenced all aspects of Peruvian culture without any acknowledgement from mainstream media or history. Luis Miguel Sanchez, Peru’s 71st President, was the first Afro-Andean President (1930–1933).
Uruguay
Main article: Afro-Uruguayan
A 2009 DNA study in the American Journal of Human Biology showed the genetic composition of Uruguay as primarily European, with Native American ancestry ranging from one to 20 percent and sub-Saharan African from seven to 15 percent (depending on region).[68]
Enslaved Africans and their descendants figured prominently in the founding of Uruguay.
In the late 18th century, Montevideo became a major arrival port for slaves, most brought from Portuguese colonies of Africa and bound for the Spanish colonies of the New World, the mines of Peru and Bolivia, and the fields of Uruguay.
In the 19th century, when Uruguay joined other colonies in fighting for independence from Spain, Uruguayan national hero Jose Artigas led an elite division of black troops against the colonists. One of his top advisors was Joaquín Lenzina, known as Ansina, a freed slave who composed musical odes about his commander’s exploits and is regarded by Afro-Uruguayans as an unheralded father of the nation.
Venezuela
Main article: Afro-Venezuelan
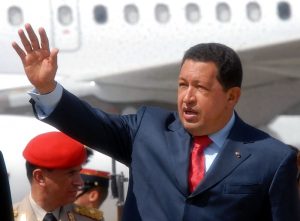
Image above shows The late President Hugo Chávez was the first afrodescendiente to serve as head of state of Venezuela.
African Venezuelans are mostly descendants of enslaved African brought to Venezuela from the 17th to the 19th century to work the coffee and cocoa crops. Most of the African-Venezuelans live in the North-central region, in the coastal towns Barlovento, Northern Yaracuy, Carabobo and Aragua States, and Eastern Vargas State; but also in several towns and villages in areas in South Lake Maracaibo (Zulia State) and Northern Merida State in the Andes, among others. They have kept their traditions and culture alive, especially through music.
Venezuela is a very racially mixed nation. Research in 2001 on genetic diversity by the Venezuelan Institute of Scientific Research (Instituto Venezolano de Investigaciones Científicas, IVIC) in which the population was compared to the historical patterns of the colonial castes. According to the last population census in Venezuela conducted by the National Institute Estadististica (INE), the population in the country afrodescendienten represents 2.8% of the national total, which is 181 157 result in the number of Venezuelans with African racial characteristics.[69]
Afro-Venezuelans have stood out as sportsmen, many of them in the Major League Baseball and other sports (e.g. former NBA/Houston Rockets forwardCarl Herrera), however, most of them do not describe themselves as Afro-Venezuelan, but as Latinos or Hispanics or simply Venezuelans. Afro-Venezuelans have also stood out in the arts, especially in music, for example: Magdalena Sánchez, Oscar D’León, Morella Muñoz, Allan Phillips, Pedro Eustache, Frank Quintero, and many others. Miss Venezuela 1998, Carolina Indriago, Miss Venezuela Universe 2006, Jictzad Viña, and Miss Venezuela World 2006, Susan Carrizo are mulatto.
|
Continent or region |
Country population |
Afro-descendants |
[16] Black and black-mixed population |
|
388,570,461 |
N/A |
N/A |
|
|
190,732,694 |
7.61% (black) + 20,6% (mulatto pardos) |
14,517,961 (black) |
|
|
45,925,397 |
4.0% (black) + 3.0% (Zambo) + 14.0% (Mulatto) |
1,837,015 + 1,377,762 + 6,429,556 |
|
|
13,927,650 |
4.9% |
680,000 |
|
|
29,496,000 |
2.0% |
589,920 |
|
|
770,794 |
36.0% |
277,486 |
|
|
475,996 |
37.0% |
223,718 |
|
|
6,349,000 |
3.5% (Mulatto) |
222,215 |
|
|
27,227,930 |
2.8% (black) |
181,157 |
|
|
3,494,382 |
4.0% |
139,775 |
|
|
199,509 |
66.0% |
131,676 |
|
|
10,907,778 |
~0.5% |
54,539 |
|
|
40,091,359 |
~0.12% |
~50,000 |
|
|
17,094,270 |
< 0.1% |
0* |